mlkem768-decaps/openssl
|
|
Additional Statistics:
| Lower bound | Estimate | Upper bound | |
|---|---|---|---|
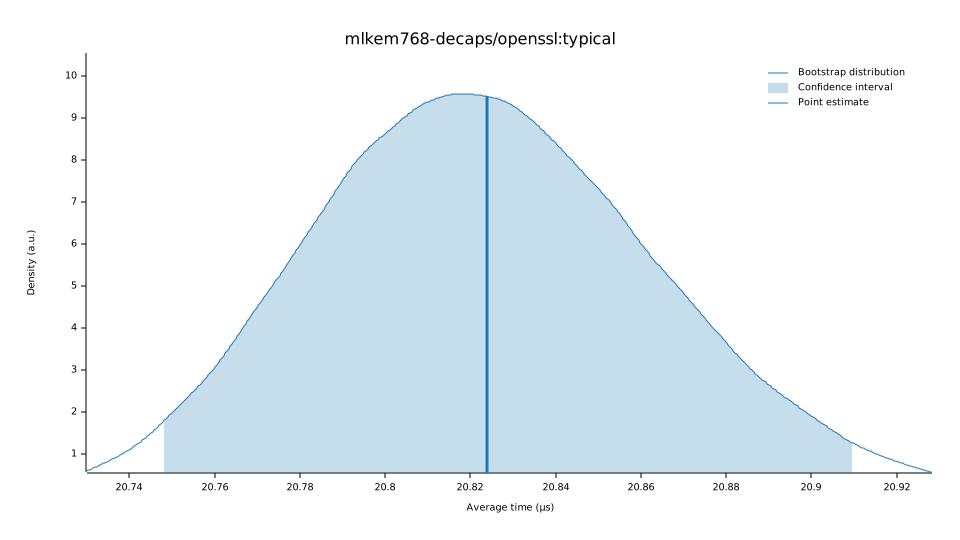
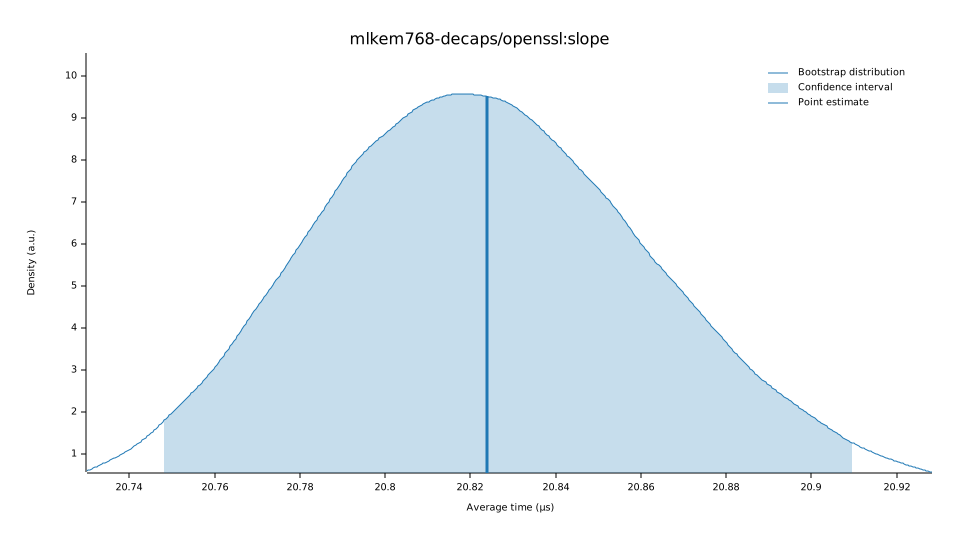
| Slope | 20.748 µs | 20.824 µs | 20.910 µs |
| Throughput | 47.824 Kelem/s | 48.022 Kelem/s | 48.198 Kelem/s |
| R² | 0.9635677 | 0.9653324 | 0.9630454 |
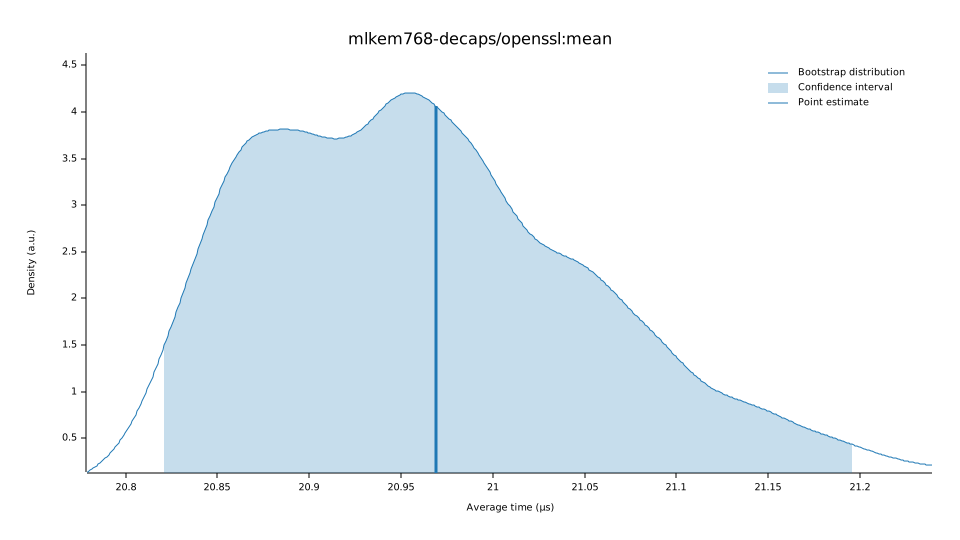
| Mean | 20.820 µs | 20.969 µs | 21.197 µs |
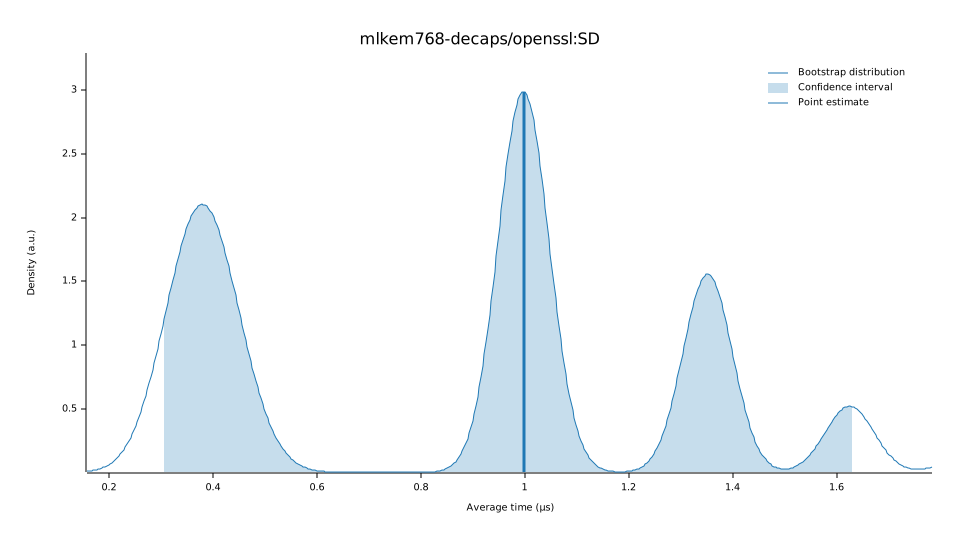
| Std. Dev. | 303.99 ns | 998.28 ns | 1.6339 µs |
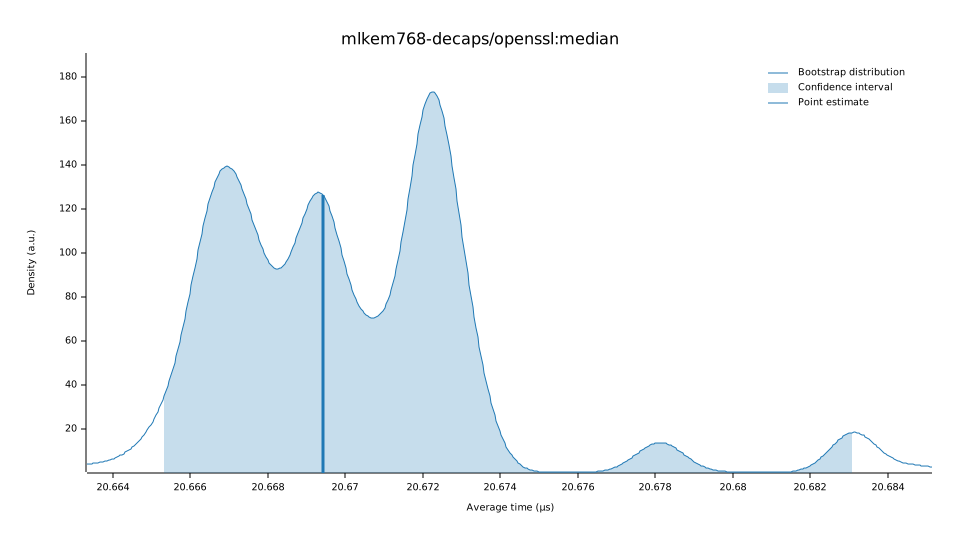
| Median | 20.665 µs | 20.669 µs | 20.683 µs |
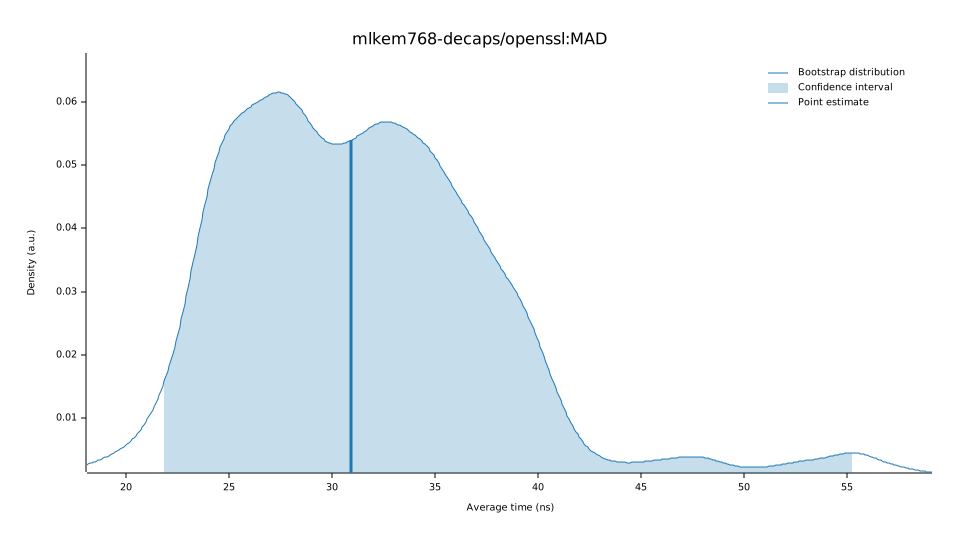
| MAD | 21.791 ns | 30.906 ns | 55.372 ns |
Understanding this report:
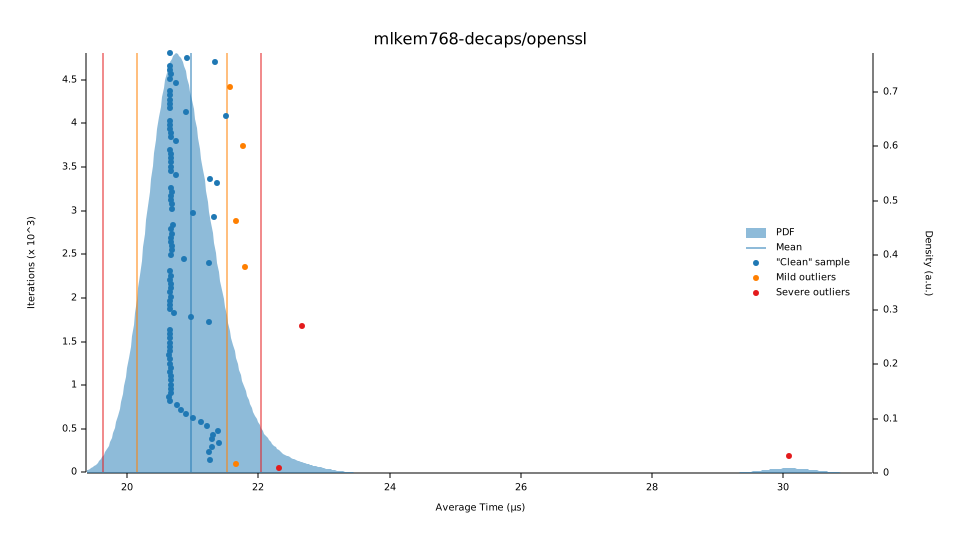
The plot on the left displays the average time per iteration for this benchmark. The shaded region shows the estimated probability of an iteration taking a certain amount of time, while the line shows the mean. Click on the plot for a larger view showing the outliers.
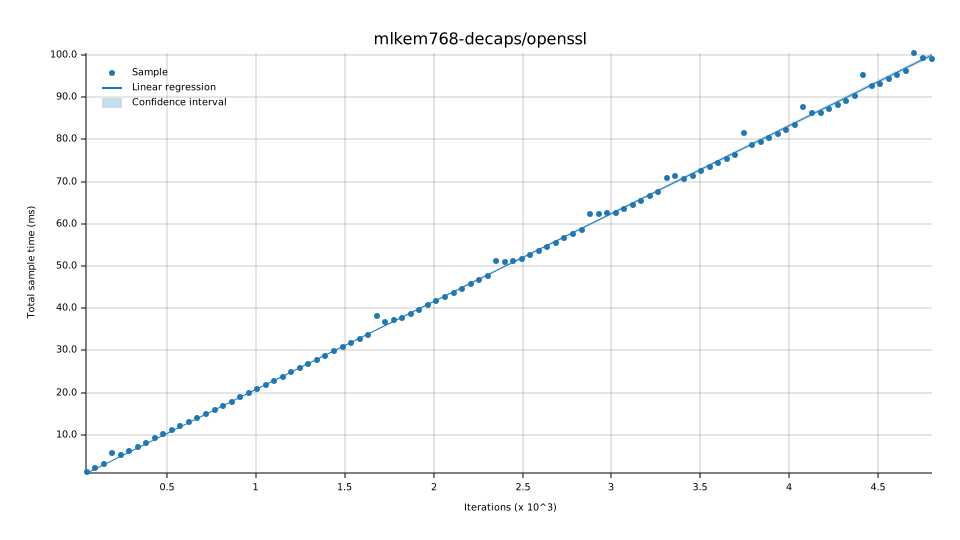
The plot on the right shows the linear regression calculated from the measurements. Each point represents a sample, though here it shows the total time for the sample rather than time per iteration. The line is the line of best fit for these measurements.
See the documentation for more details on the additional statistics.